This week I’m with the atmospheric research team at NIWA Wellington centred at Evan’s Bay along the Wellington Harbour side, providing the ultimate indoor-outdoor laboratory flow. This is the hub of the creation of the atmospheric technology that is deployed to various atmospheric monitoring stations across New Zealand. When we want to measure the atmosphere in the cleanest and remotest ends of the Southern Hemisphere, these instruments will even they make their way onto the RV Tangaroa and down to Antarctica.
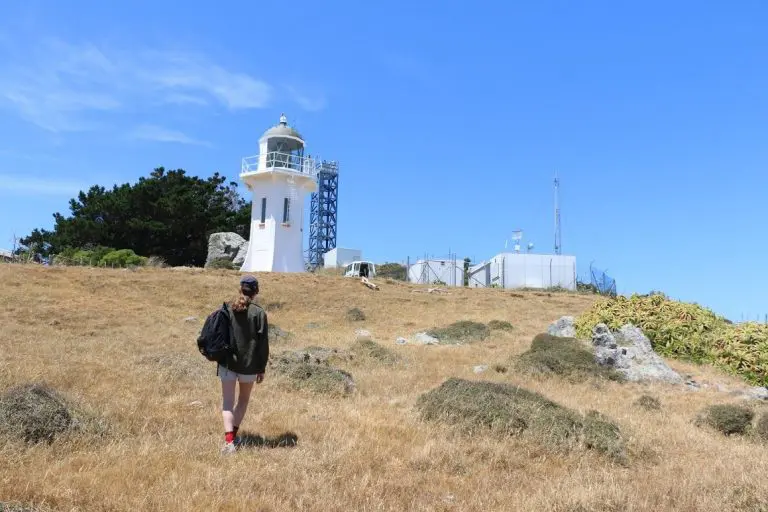
The centre also happens to be an hour away from one the most strategic places in the Southern Hemisphere for measuring the background state of the atmosphere – Baring Head, situated along the Southern coast of the North Island facing both the Cook Strait and Wellington Harbour. The station is perched upon an 80-metre cliff enclosed by the surrounding dramatic scenery. The site is the ideal location for measurement of the atmospheric composition coming from all wind directions – providing the perfect opportunity to compare the clean air that has gone without contact with any human influence for around 4 to 10 days, with air that has passed over cities, forests, and farmland.
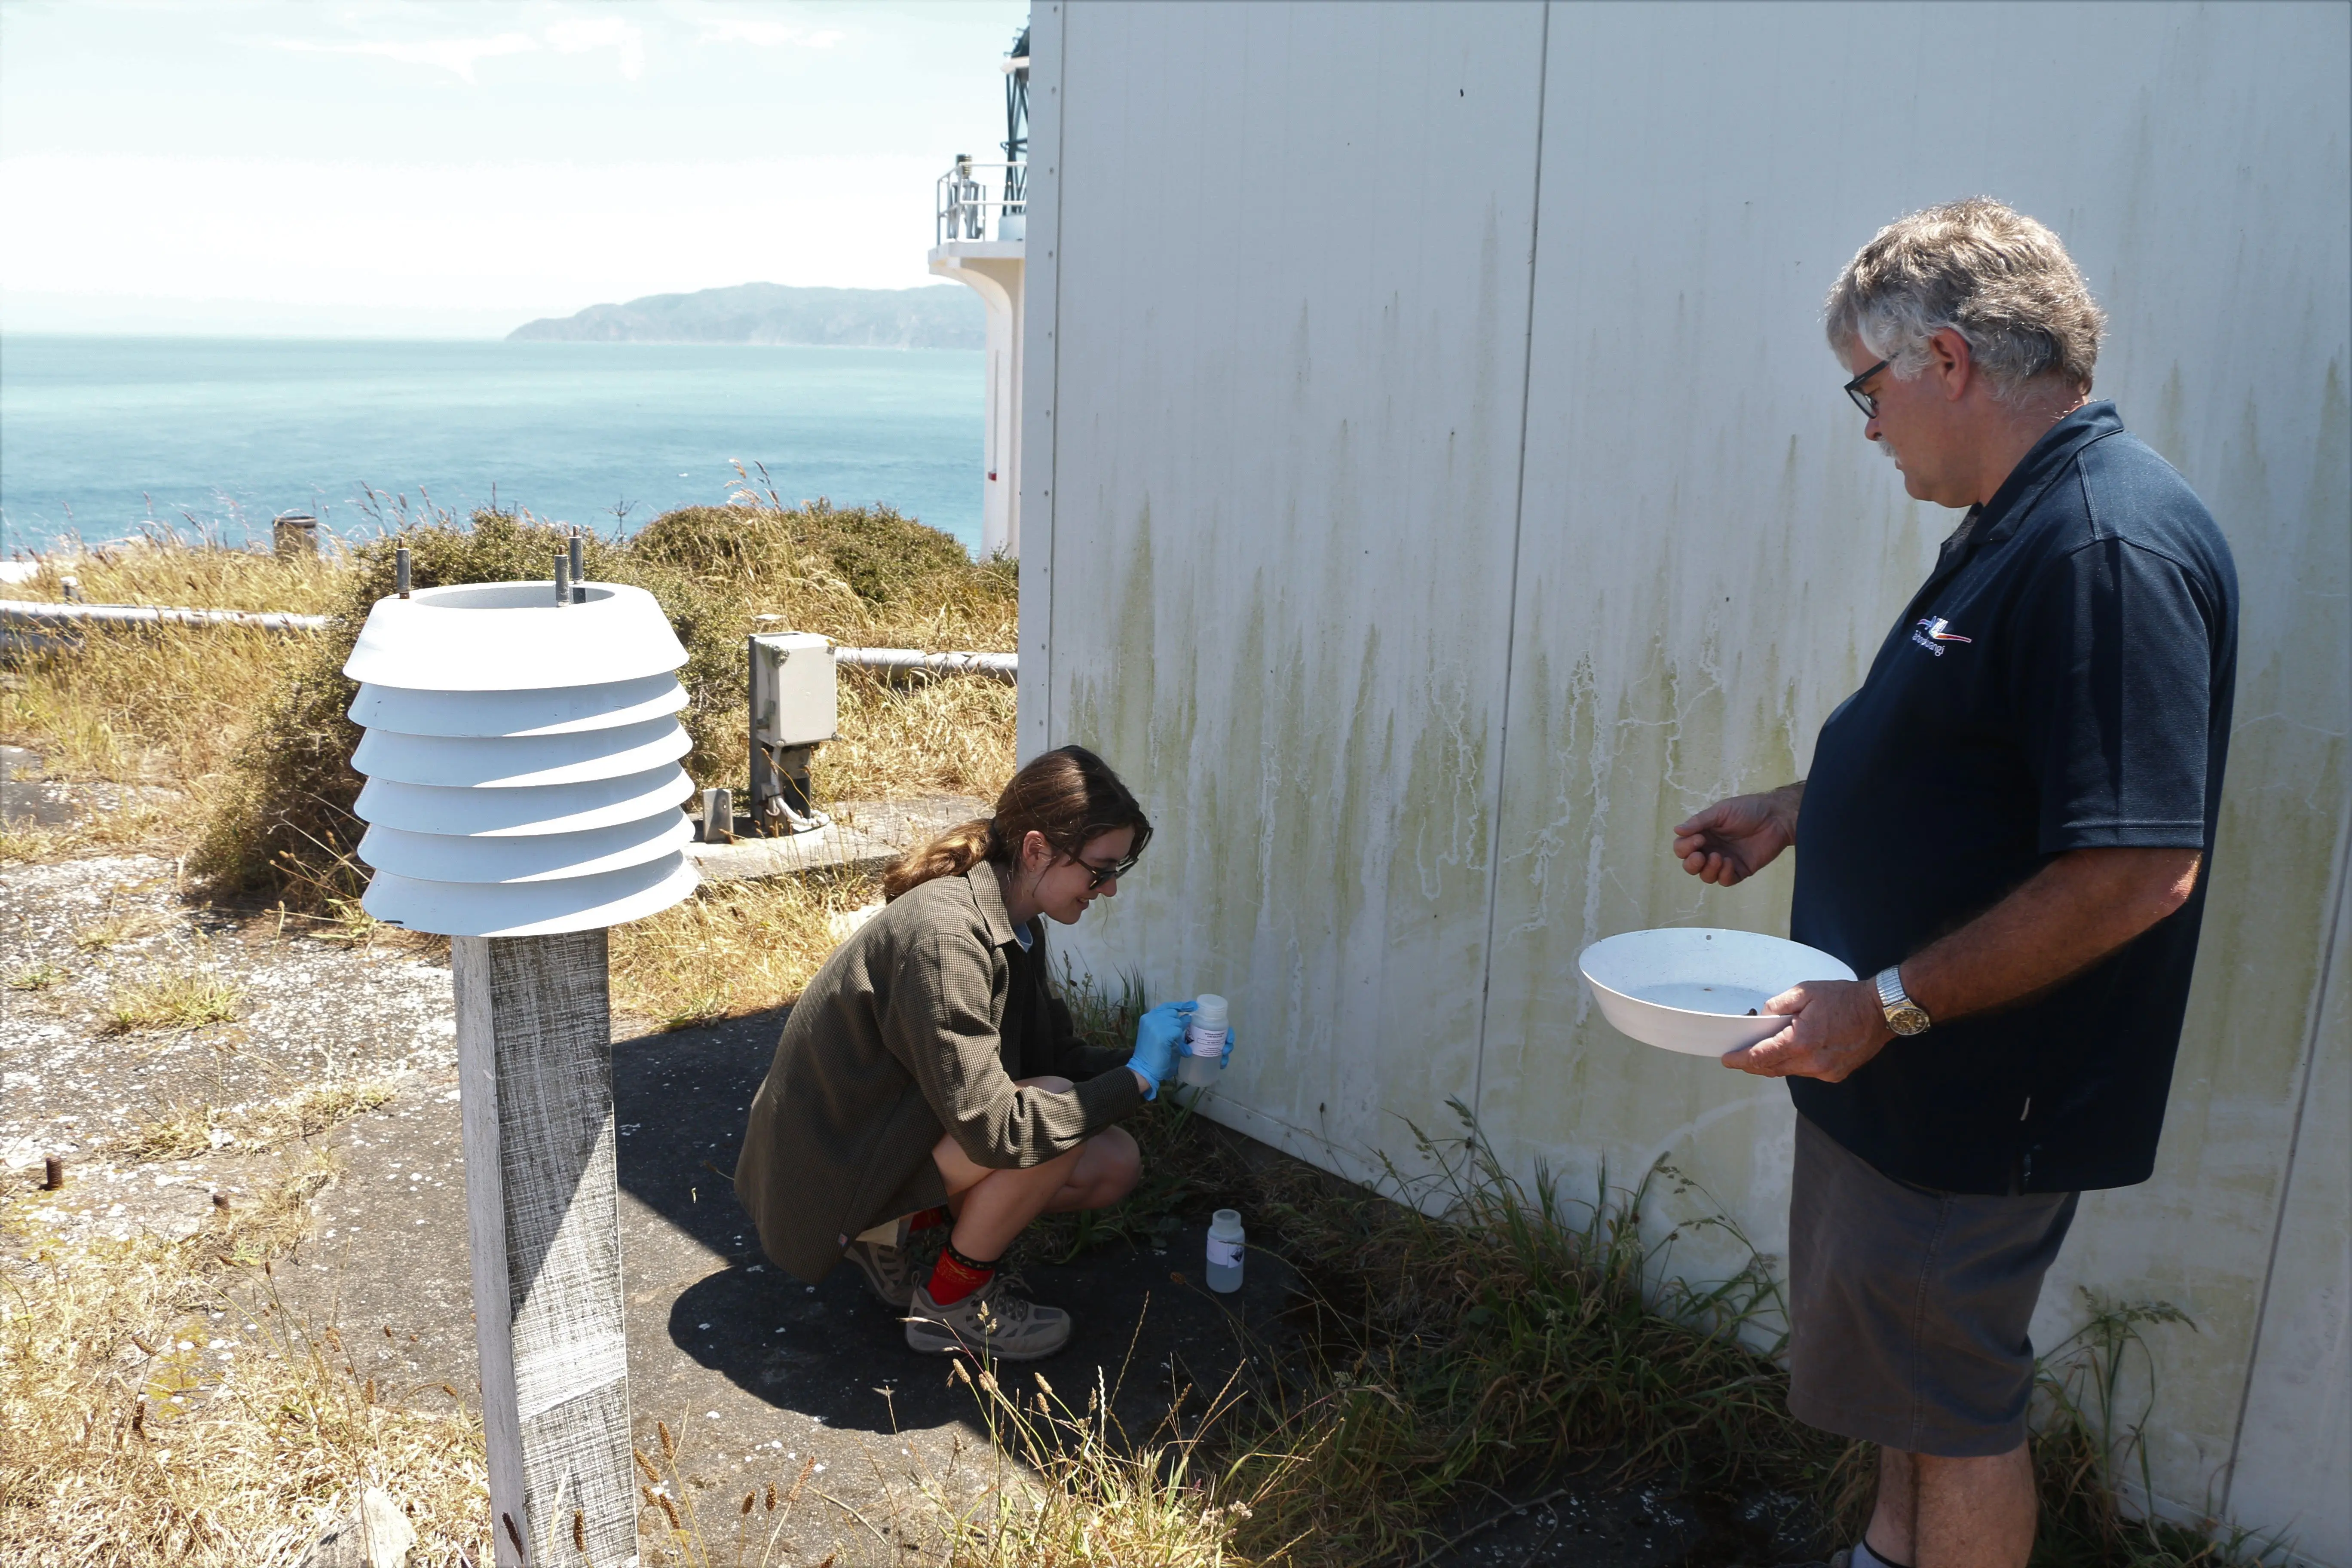
I assist NIWA Principal Technician and key operator of the site, Gordon Brailsford, in his routine updating and tinkering of the station’s instruments, designed to measure an array of atmospheric gases.
Baring Head is the longest running continuous atmospheric carbon dioxide measurement site in the Southern Hemisphere beginning in 1972. We measure most gases in the terms of the number of parts there are when there are one million parts of air. It is sobering to see measurements being carried out at the site which tracked the increase in carbon dioxide concentrations from 325 parts per million when measurements began, reaching 400 parts per million for the first time in May 2016.
Methane is the second most important greenhouse gas and its increase is linked to population growth and agricultural intensification. Ozone is also measured, although not the kind that protects us from harmful UV radiation, rather at the surface the kind that is a pollutant produced from fossil fuel combustion. Additionally, we measure Radon, a tracer gas produced in soils. Specific concentrations of Radon allow us to track the path the air has followed on its journey to Baring Head.
We check the analysers are continuously measuring all gases at every second of the day. To understand how this is achieved, I like to visualise the rainbow produced when light is shone through a prism. Where the spectrum is as red as can be, different shades of infrared radiation (or wavelengths) are absorbed by specific greenhouse gases. When dry air is forced through these analysers it meets infrared radiation, allowing individual gases to be observed by different wavelengths.
Sometimes air will be sampled directly in a glass flask, taking a snapshot of the air at one point to compare with our measurements. More alternative experiments are also maintained such as measuring the amount of radiocarbon in carbon dioxide that is taken up by caustic soda.
The measuring of gases at Baring Head can be thought of as the “Big Brother” of climate change, seeing all of New Zealand’s emissions. These measurements can then be used to verify how well the pie charts are estimating emissions from individual sectors such as transport, electricity, industry, and agriculture.
NIWA continues to compare the Baring Head data to greenhouse gas measurements from a growing number of stations across New Zealand. Combining all continuous wiggly graphs provides insights into emissions produced in regions outside of Wellington. Our carbon budgets rely on this extensive measuring of emissions to determine how effective the ocean and land are at taking up carbon dioxide. This way multifaceted atmospheric monitoring observes everything, providing answers to foretelling questions: how realistic are our targets and how will we know if we’ve actually meet them?


Lisa Dowling
BLAKE NIWA Ambassador 2017


