Amy Burney BLAKE NIWA Ambassador – Atmostphere & Climate
I spent my last week of my BLAKE NIWA ambassadorship in an entirely different environment than the first two weeks. From a busy populous NIWA site just outside of New Zealand’s capital city to Lauder in central Otago with 8 full time staff and the loudest noise around being the birds and wind outside. My first day began with a nice demonstration of remoteness, a power outage thwarting my plans of porridge for breakfast.
The NIWA site in Lauder was initially set up in the 1960’s to look at the ionosphere in the interest of satellite interference but has since switched to stratospheric and tropospheric chemistry. The more remote location of this site has resulted in the small crew having a very kiwi can do attitude where if you need something you make it, the workrooms on site including a 3D printer a testament to this, John Robinson’s 3D printer skills seem to have come in useful everywhere around the site.
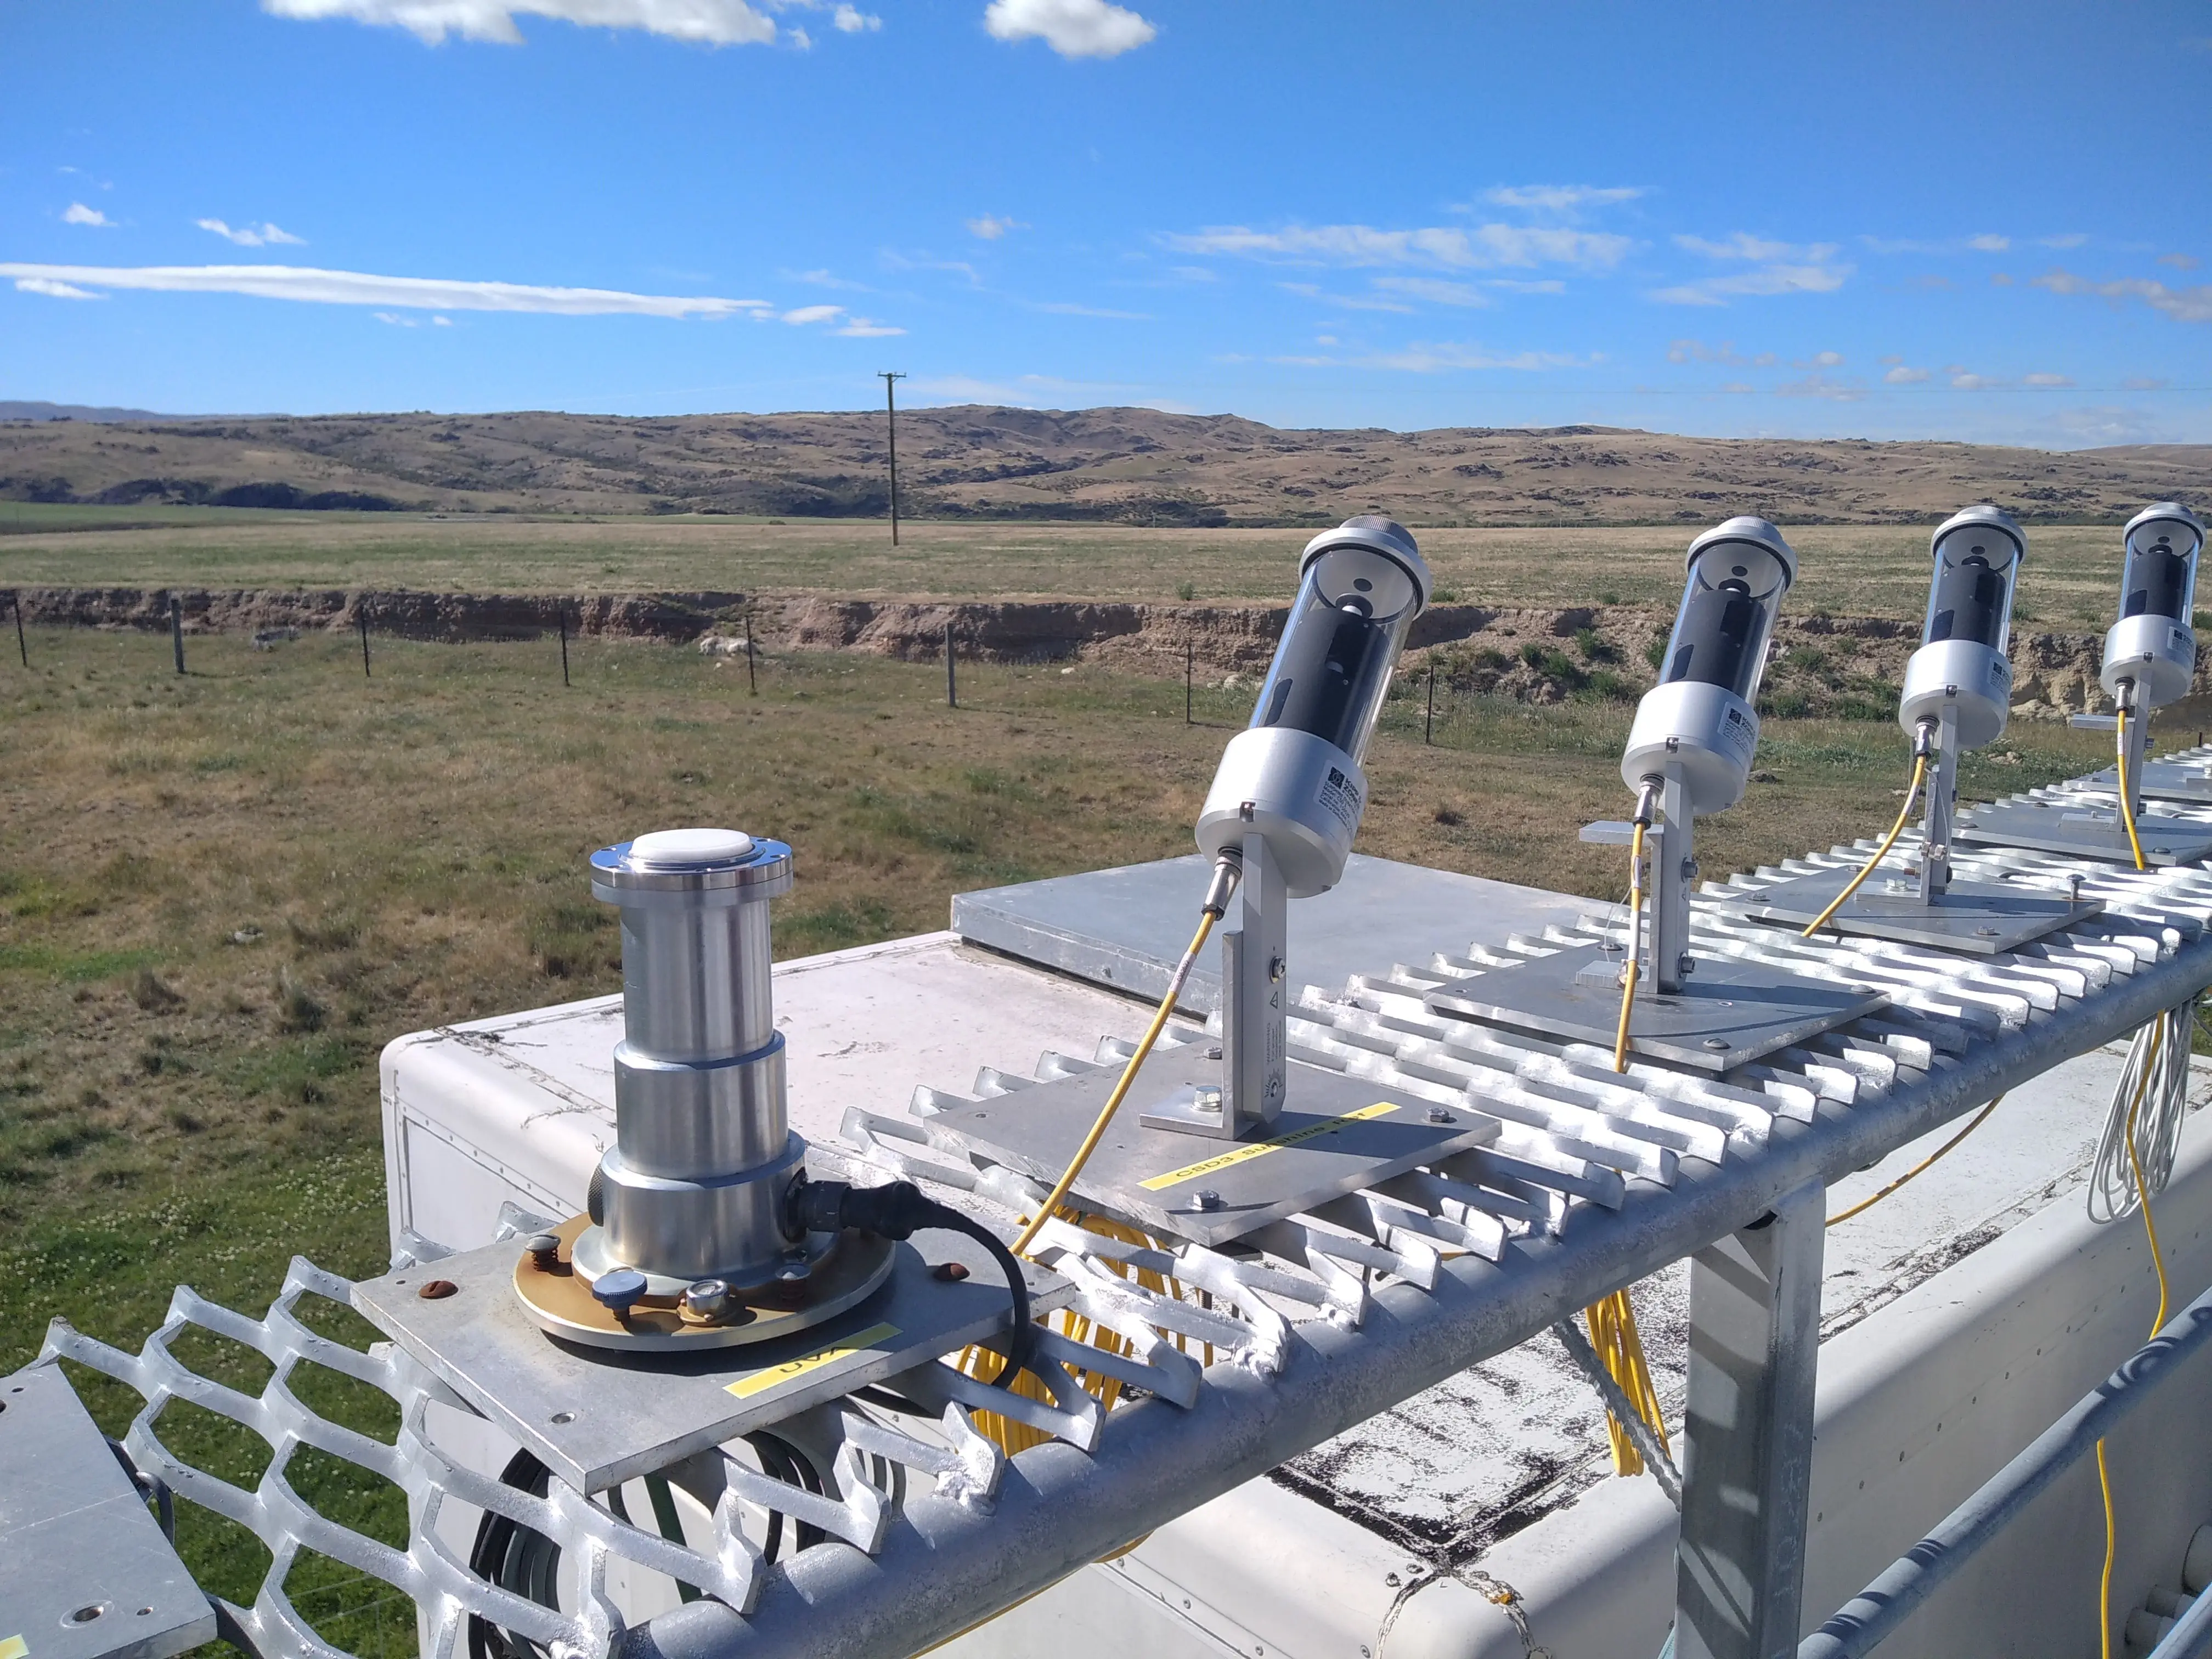
First thing I got to check out were the large variety of light sensors and imaging devices of all shapes and sizes on the roof of one of the buildings with pictures of the entire sky taken to calculate the amount of cloud cover present. One of the days during the week I even got to watch Mike Kotkamp calibrate one of the UV sensors.
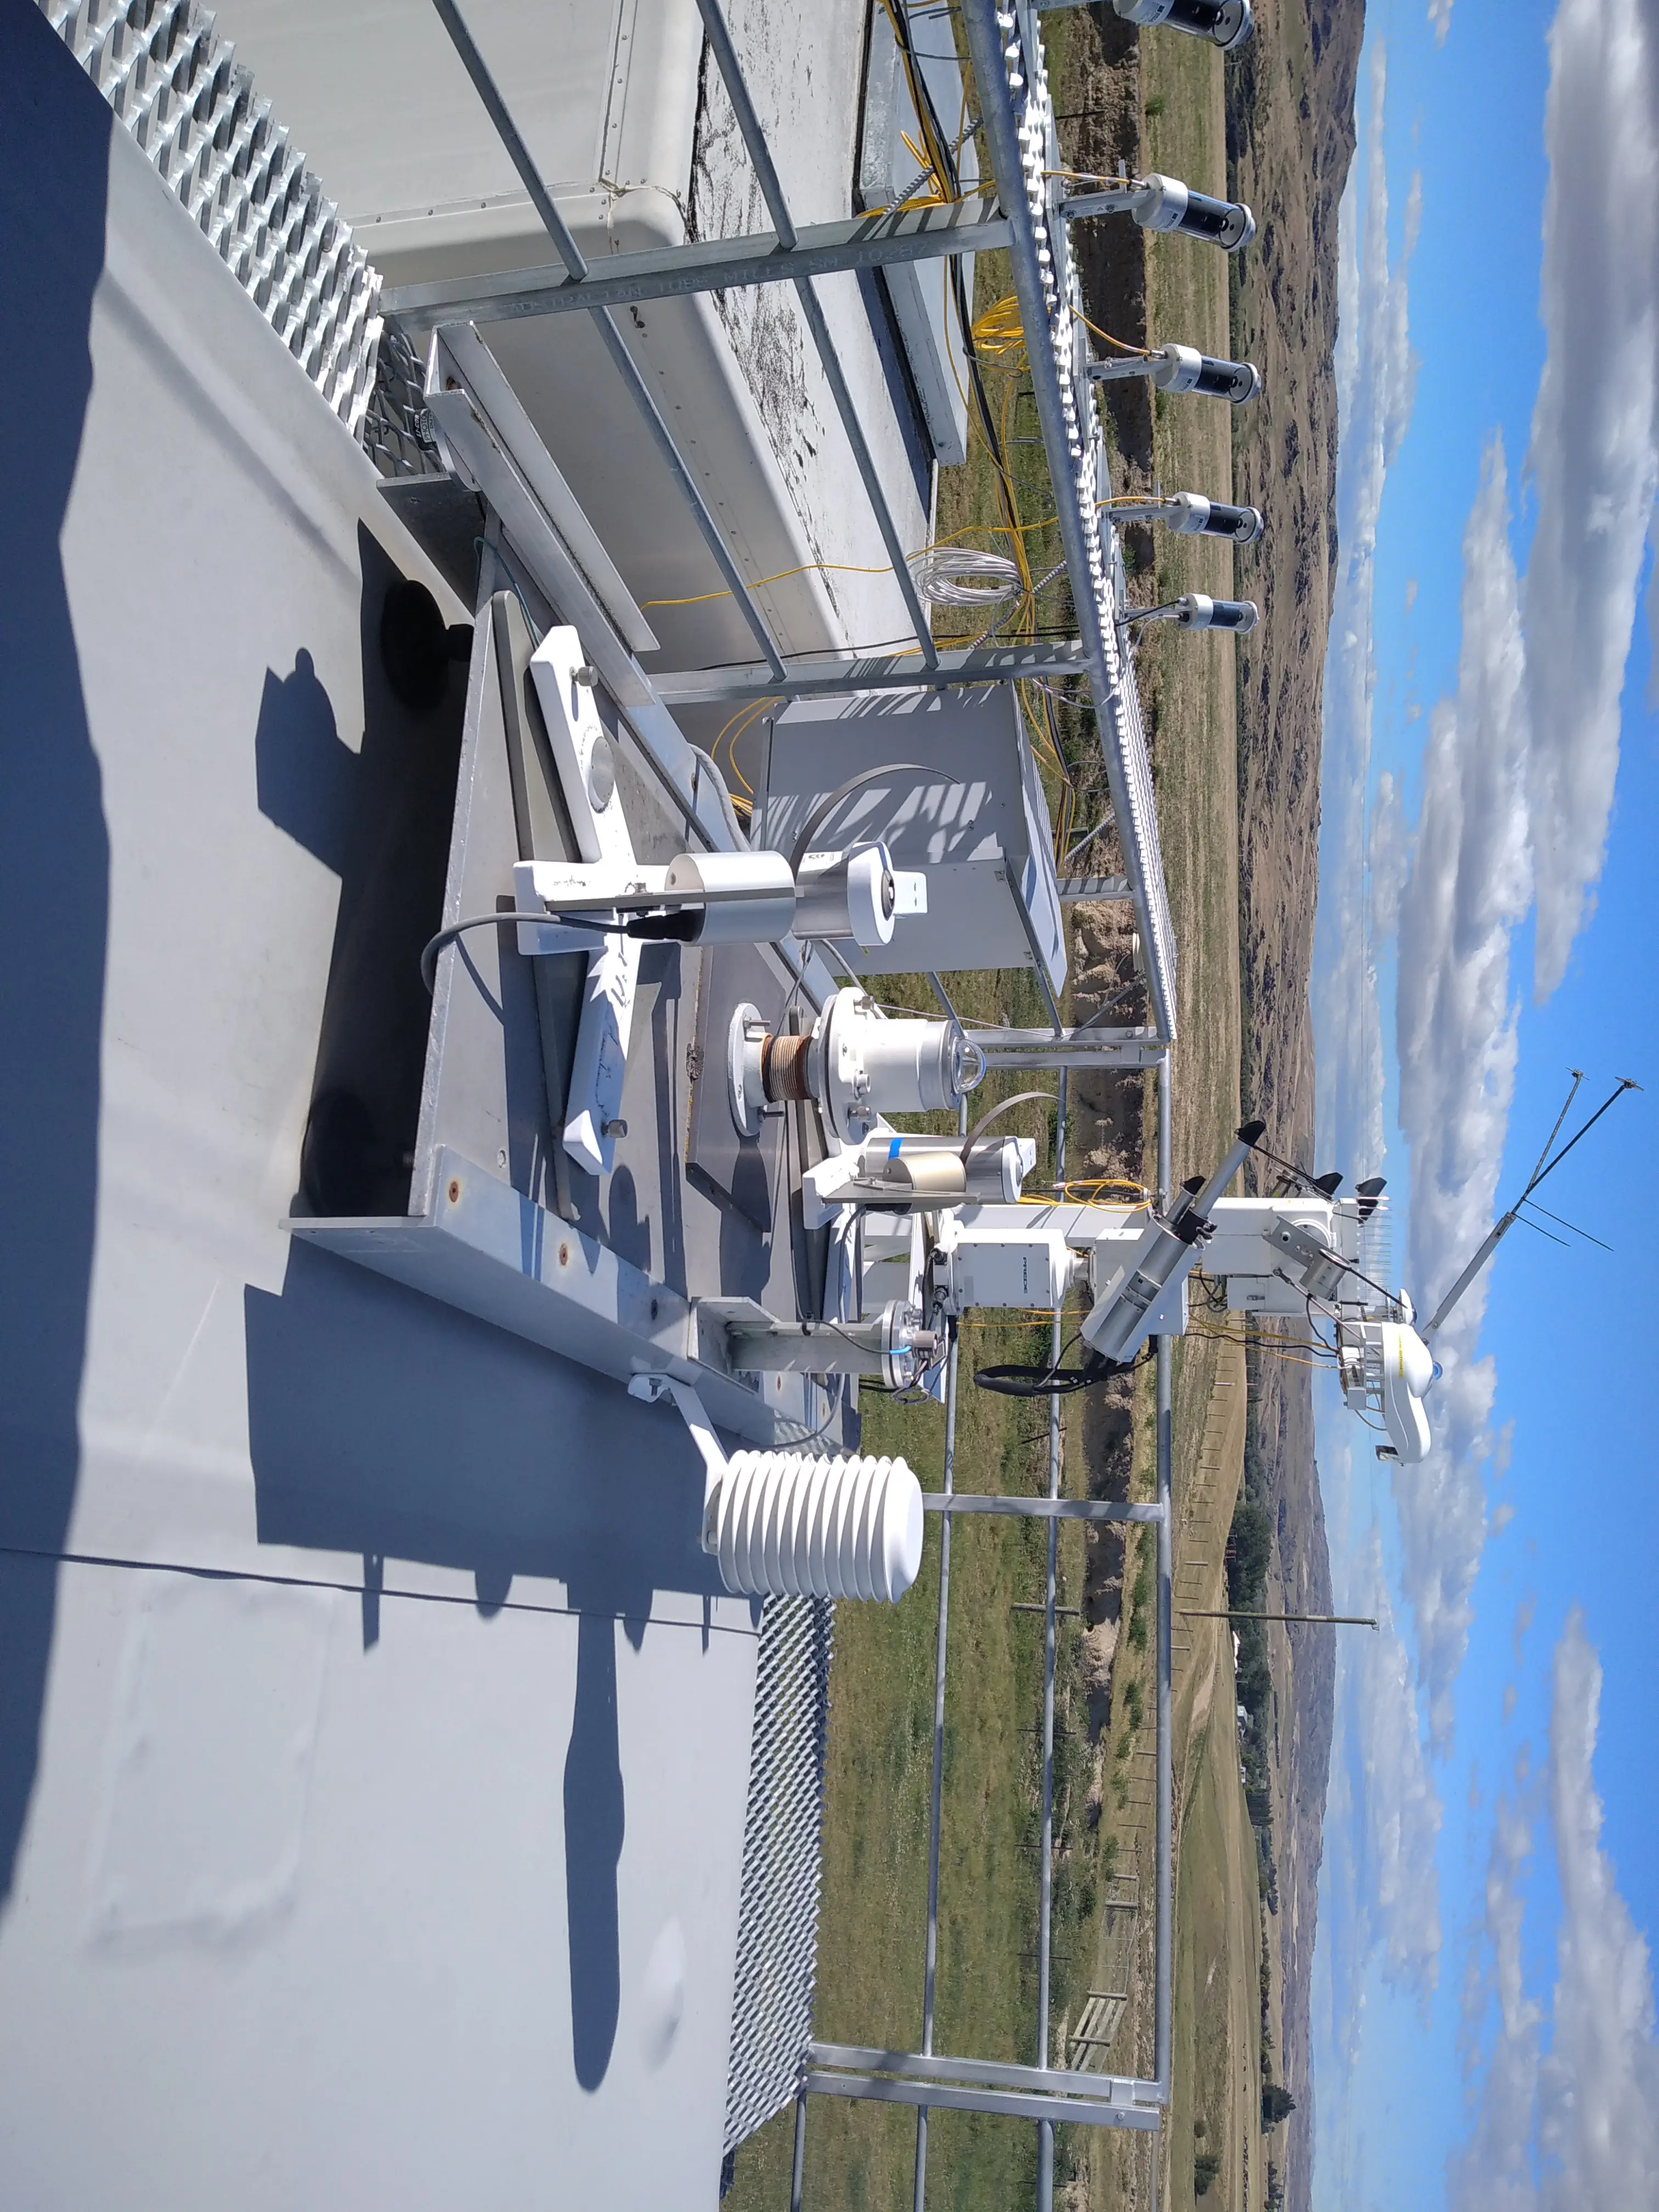
The large array of sensors on the roof
Inside I got shown some mid and near IR Fourier transform Michelson interferometers (Bruker spectrometers) which break down the incoming sunlight into different frequencies with a beam splitter and varied path lengths to create an interference pattern able to be used to determine the absorbance features of the atmosphere between the incoming sunlight and the receiver, measuring atmospheric trace gases (Ozone, greenhouse gases and other man-made pollutants, HCl). The calculated cloud covers are used to get rid of files from when lots of cloud is present. Data collected by this instrument and many others is submitted to with data frequently used by researchers in New Zealand and overseas.
In the other room was a spectrum analyser which takes in gas directly from outside air and uses similar spectral techniques to determine the CO2, CH4, H2O, N2O, CO and 13CO2 measurements.
Out in the field beside this building was a lone measuring structure used to measure the CO2 and water fluxes from the paddock this is one monitoring station erected as part of Sara Mikaloff-Fletcher’s carbon watch project. I joined Dan Smale as he collected some meta data associated with the site, downloading time lapses of the field to monitor land use and paddock growth, measuring the grass growth by rising plate measurements, checking the level of the measurement rig and helping take a random sampling of grass in paddock around the site determining the wet and dry weight present by microwaving the cuttings. This has to be done regularly and before and after cows graze in the paddock to understand how much carbon they remove from the area.
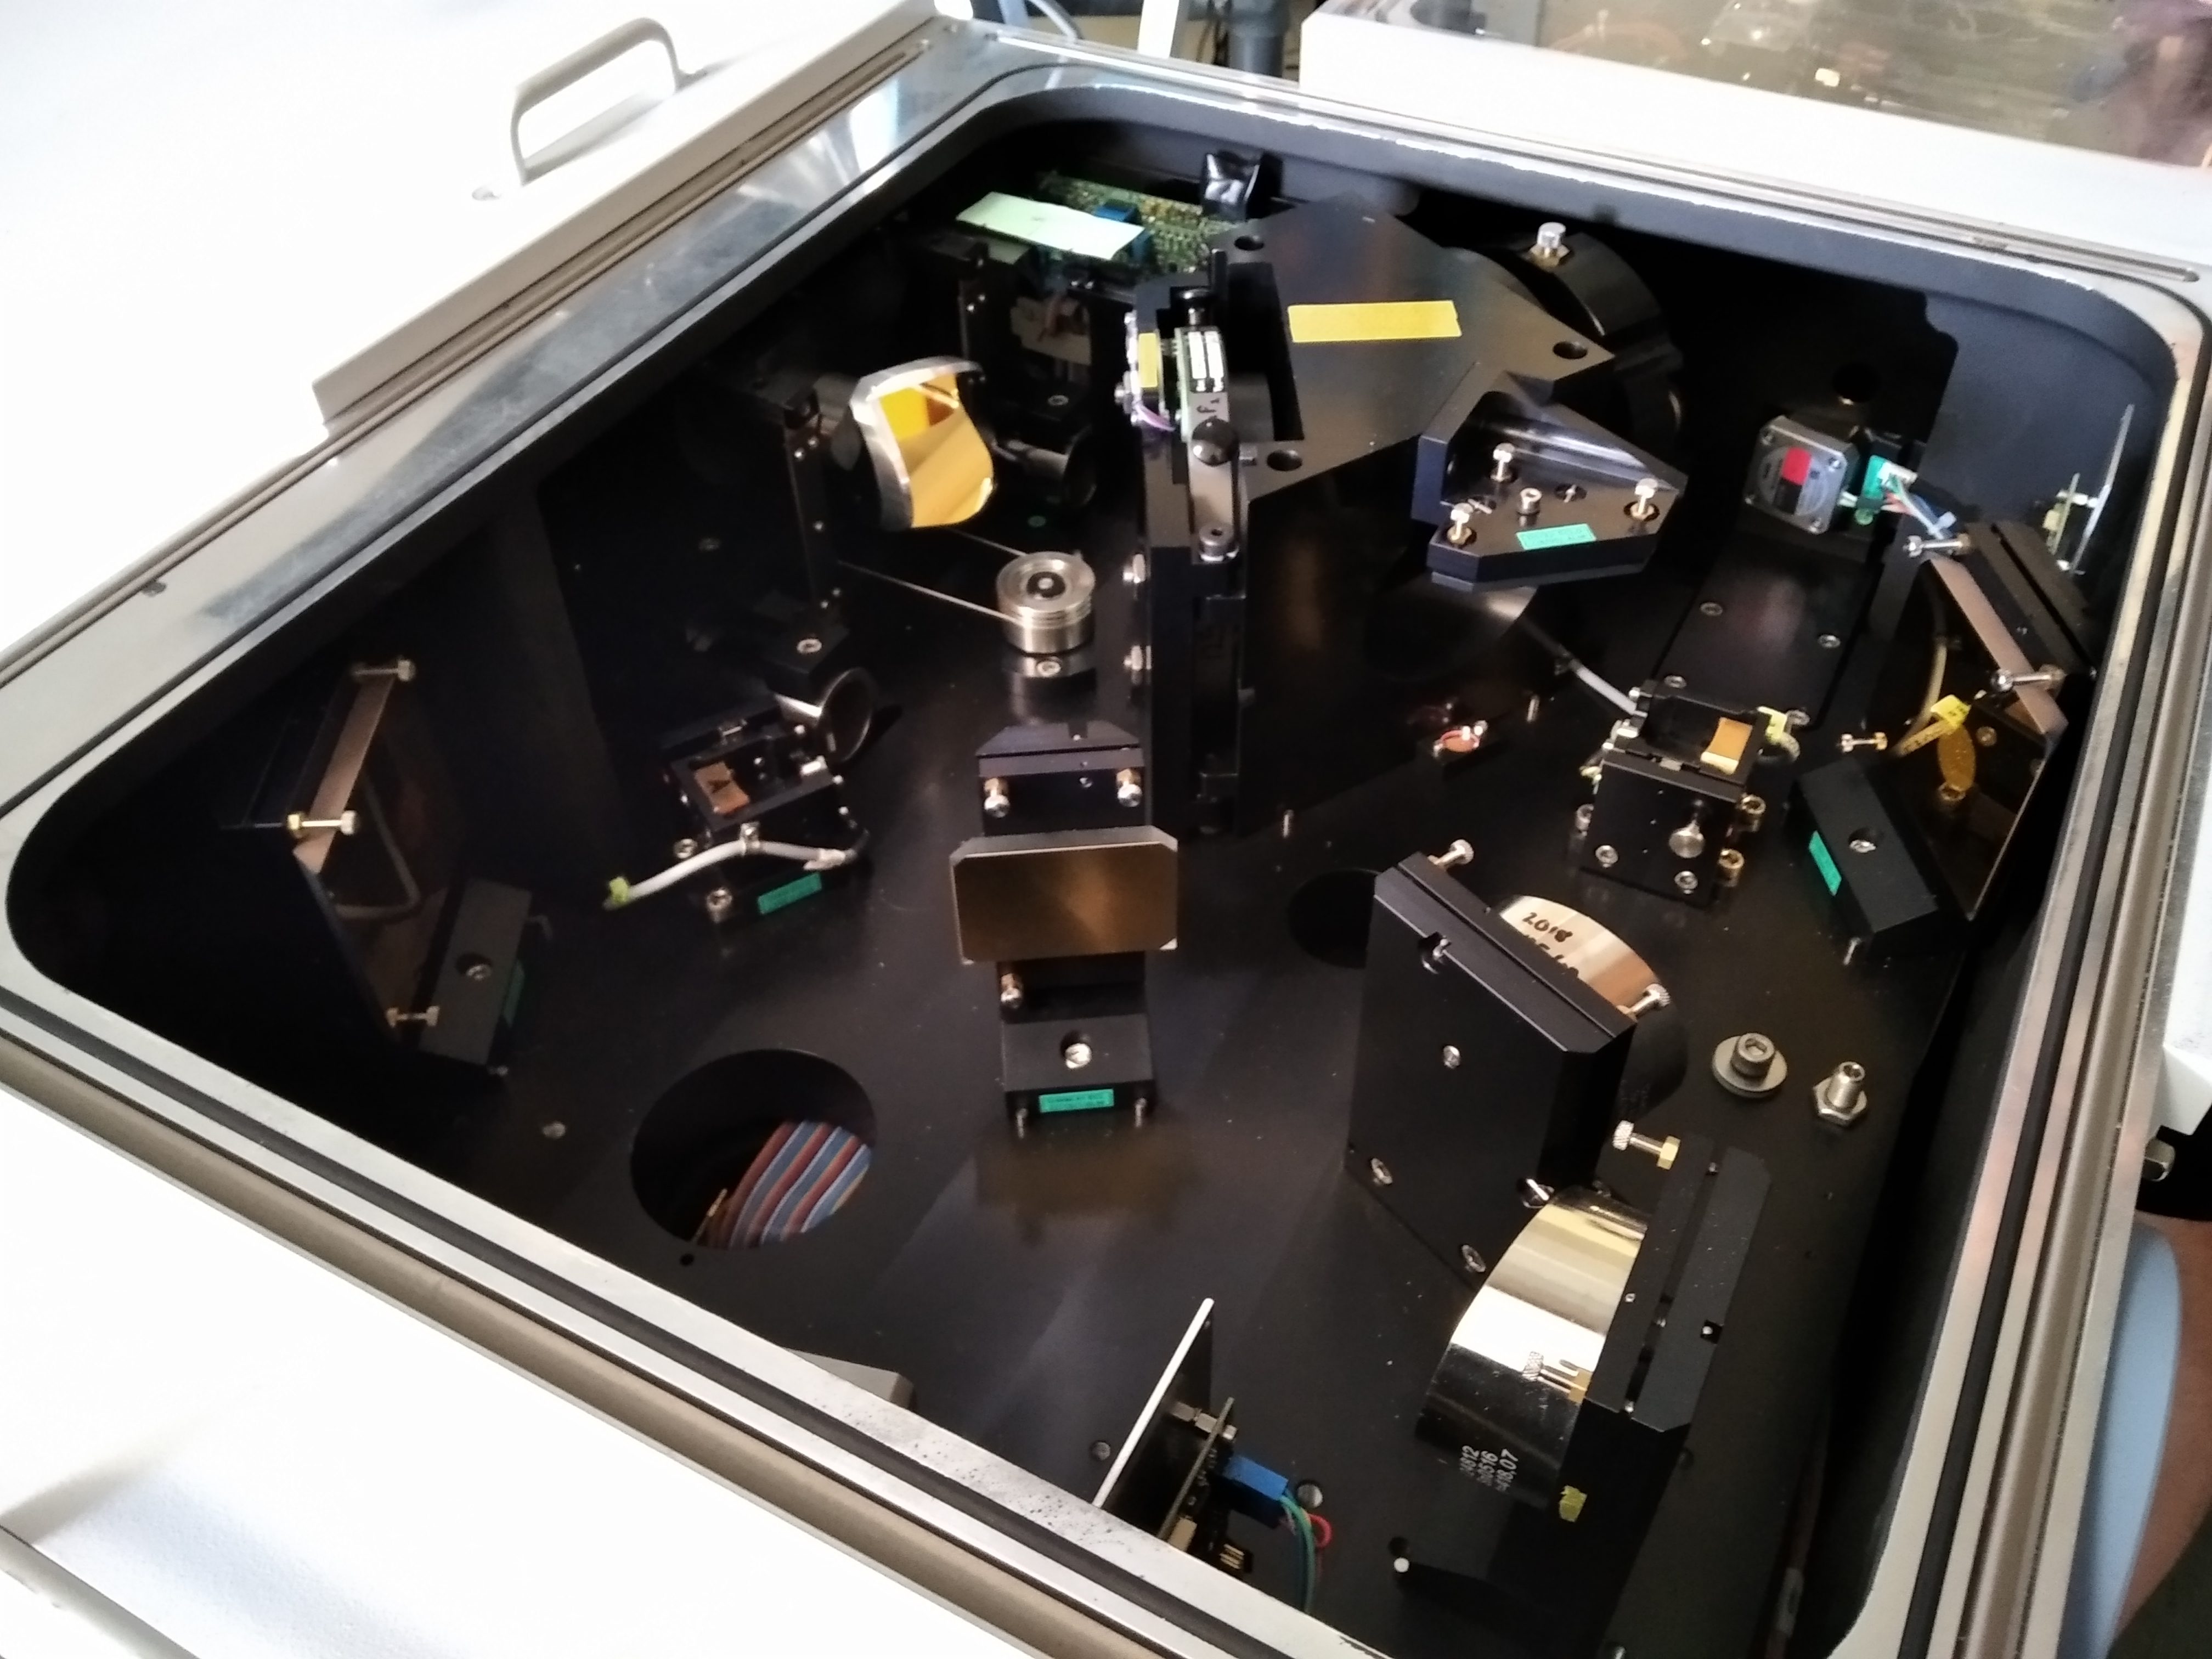
Inside one of the Brukers
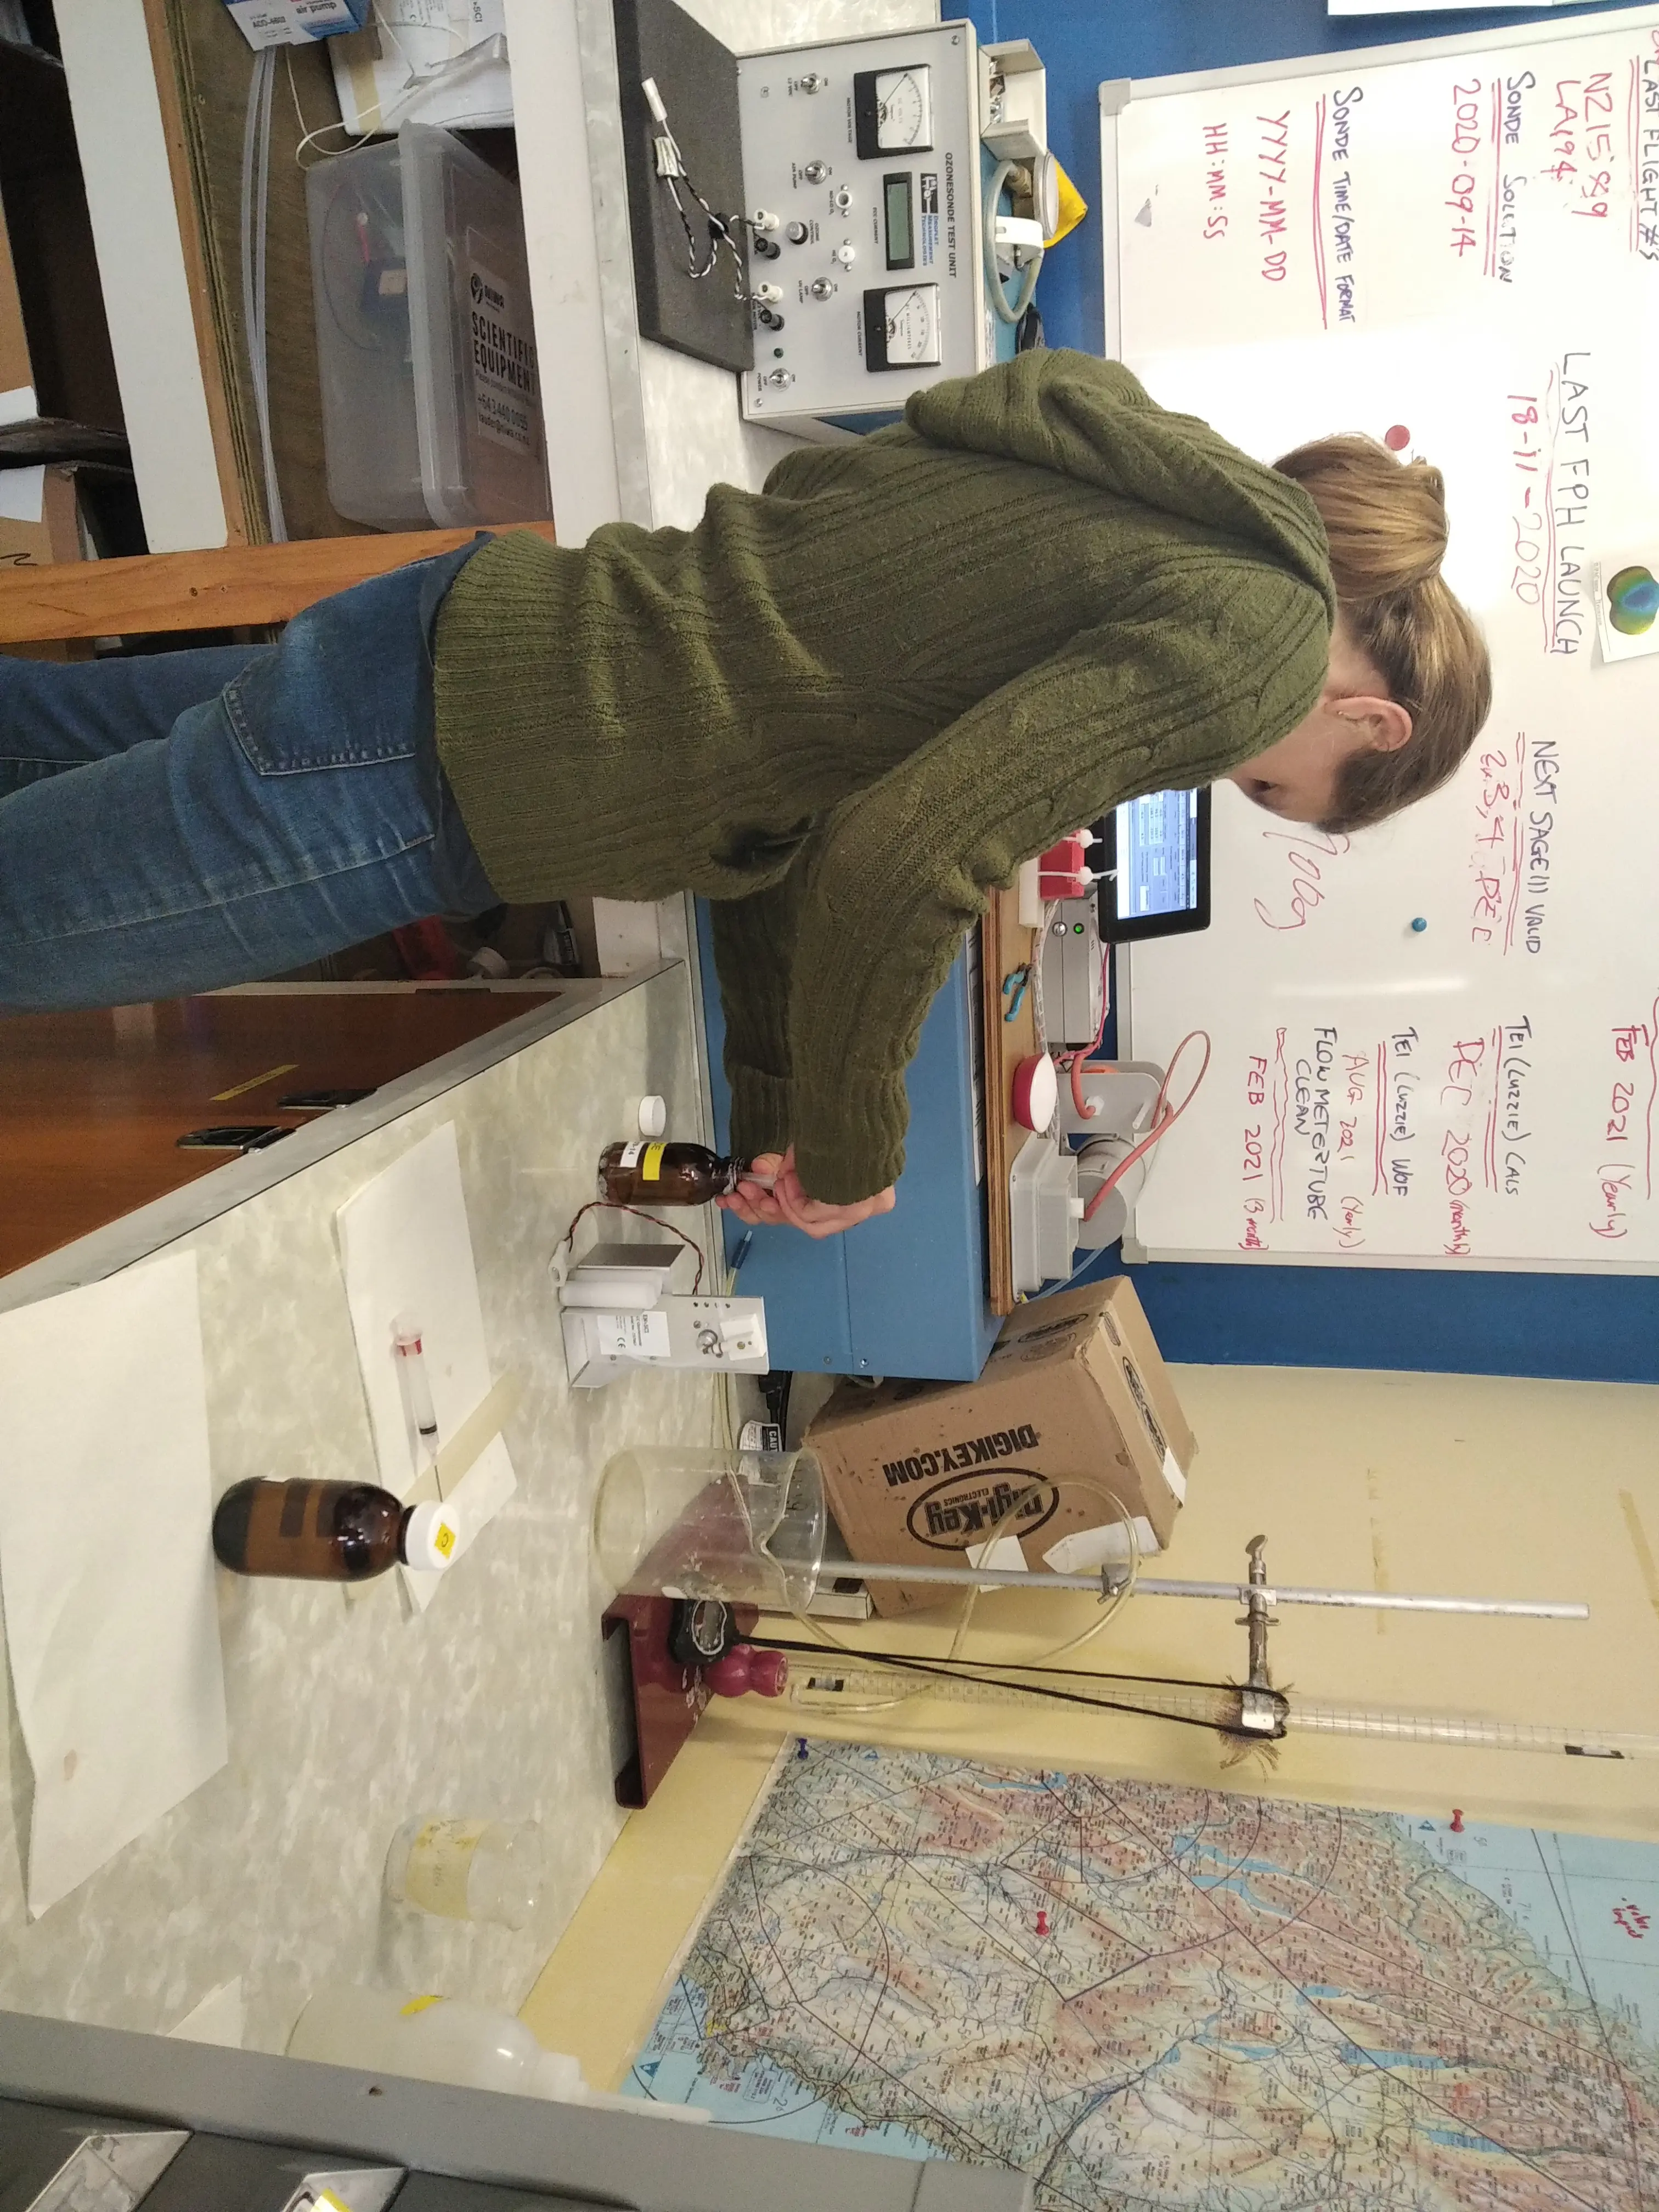
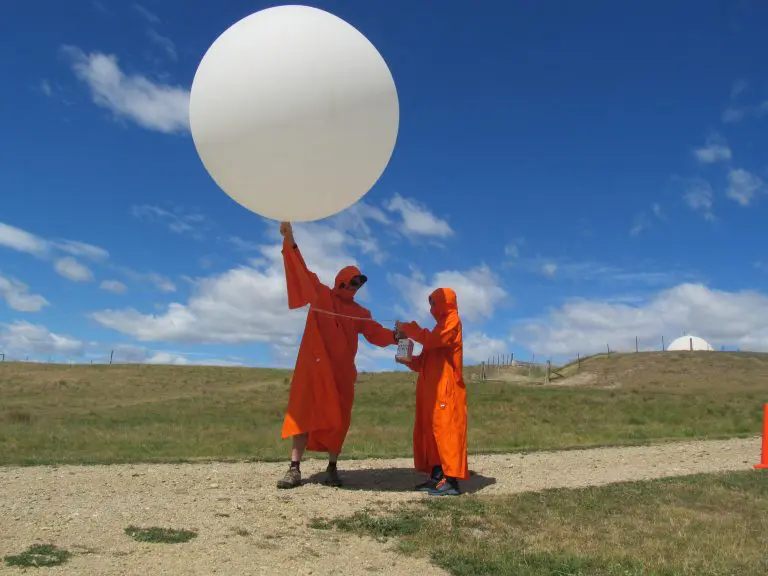
Filling electrochemical cells for ozone sondes
If you’ve ever heard of Lauder before it’ll likely be for one of two reasons, their cool sky laser or their large Sonde balloons, I can’t decide which is cooler myself. Weekly Ozone Sondes have been launched since 1987 from this site. A simple electrochemical cell with two different concentrations of KI in each Teflon half-cell is connected to a radio transmitter and sometimes other sensors is sent up to about 30km constantly transmitting connected to either a hydrogen or helium balloon. While I was in Lauder, I had the opportunity to help Penny Smale check the cells and air pumps were working properly prior to launch, changing the half-cell solutions and checking the response of the cell by application of air of known ozone concentration. We also did a balloon launch to check how well the newly installed receiver antenna worked, this was with a smaller balloon than usual and had a dummy payload that only transmitted what was necessary to track its location.
LiDAR the Light detection and ranging system is used at NIWA to detect the presence and amount of species in the total column of the atmosphere. A laser of known wavelength is fired at the sky at night with the returning beam reflected off atmospheric particles received by a telescope adjacent to the outgoing laser. For ozone this laser is produced by beam splitting of two of the hydrogen emissions, one of the wavelength ozone absorbs at and another close to it, the difference in the intensities of each laser beam received back allows calculation of the amount of ozone present.
Below you can see a Dobson ozone spectrophotometer, this important piece of equipment has been onsite since the 1930’s. The Dobson is used for measuring total column ozone using a spectrophotometer multiple times a day with the amount of ozone returned in Dobson units (how much ozone is in the total column if squashed down removing all other gases). The Dobson is a particularly special piece of equipment as it is one of the earliest ozone measurement instruments and a Dobson spectrophotometer was responsible for initially discovering the presence of the ozone hole above Antarctica, satellites passing overhead disregarded the presence of such a feature as the ozone measurements were below their threshold and disregarded as anomalies. Only a Dobson in Antarctica which had been checked and checked again proved that it existed.
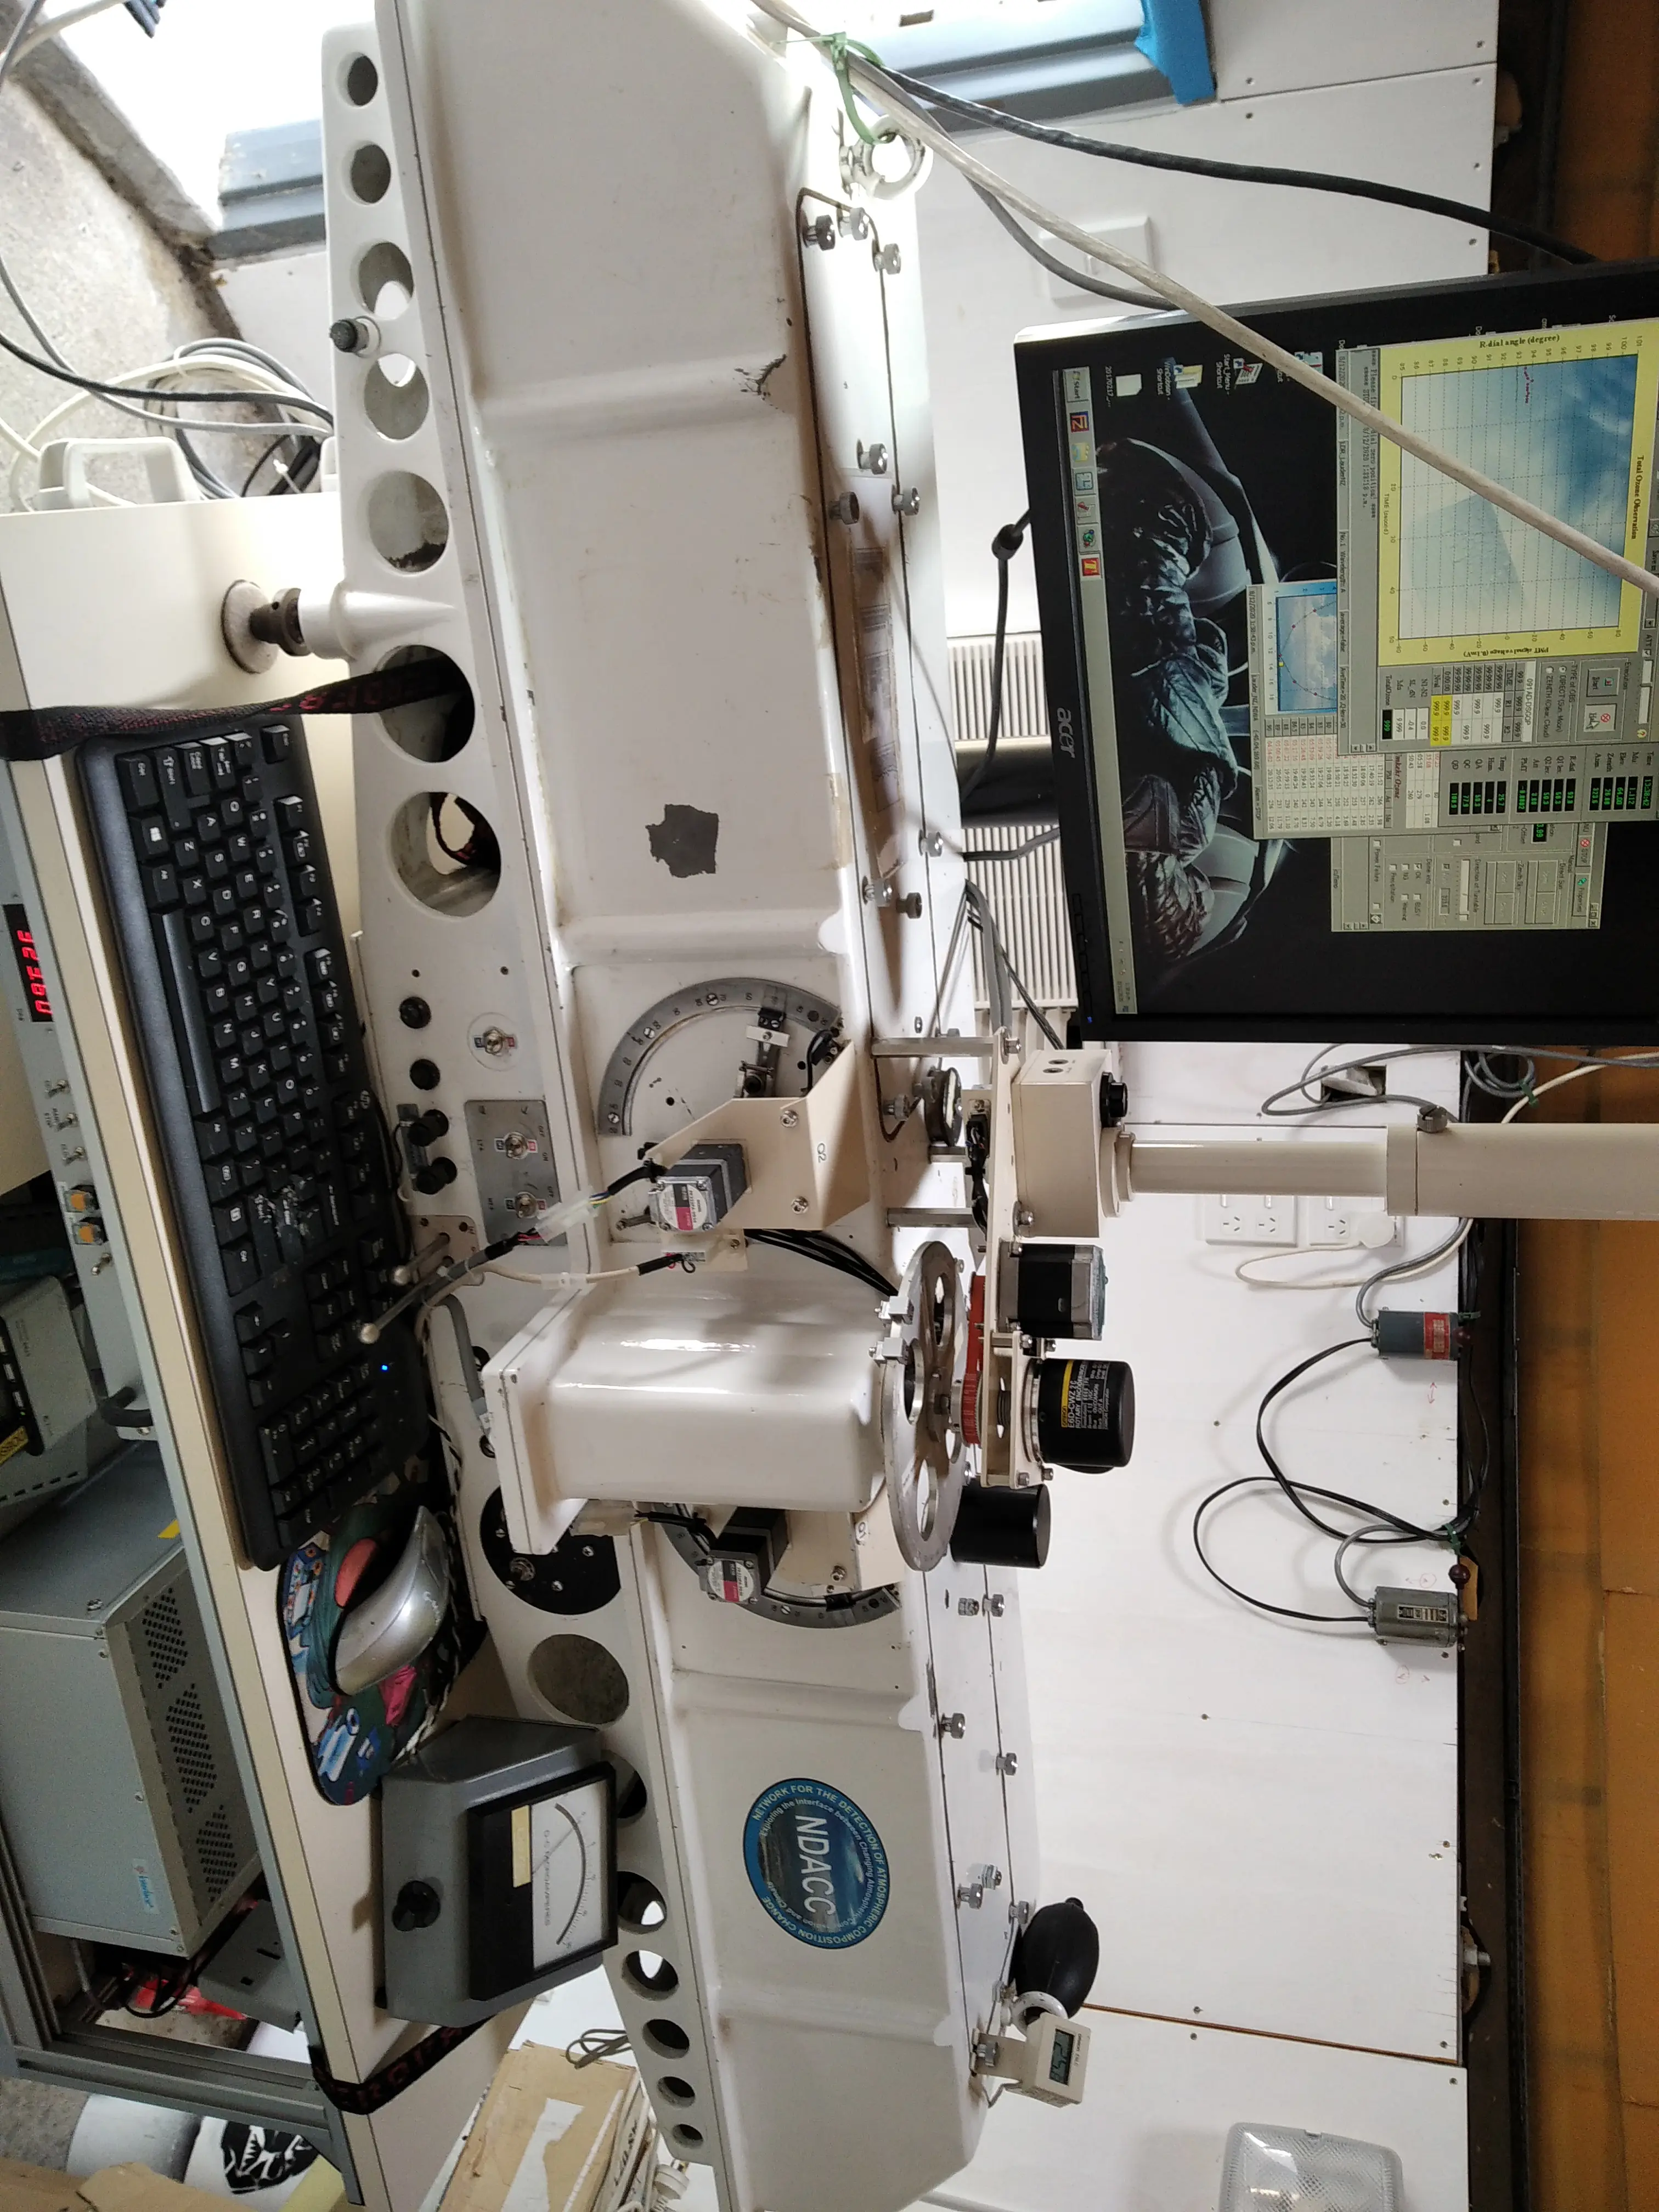
Dobson spectrophotometer
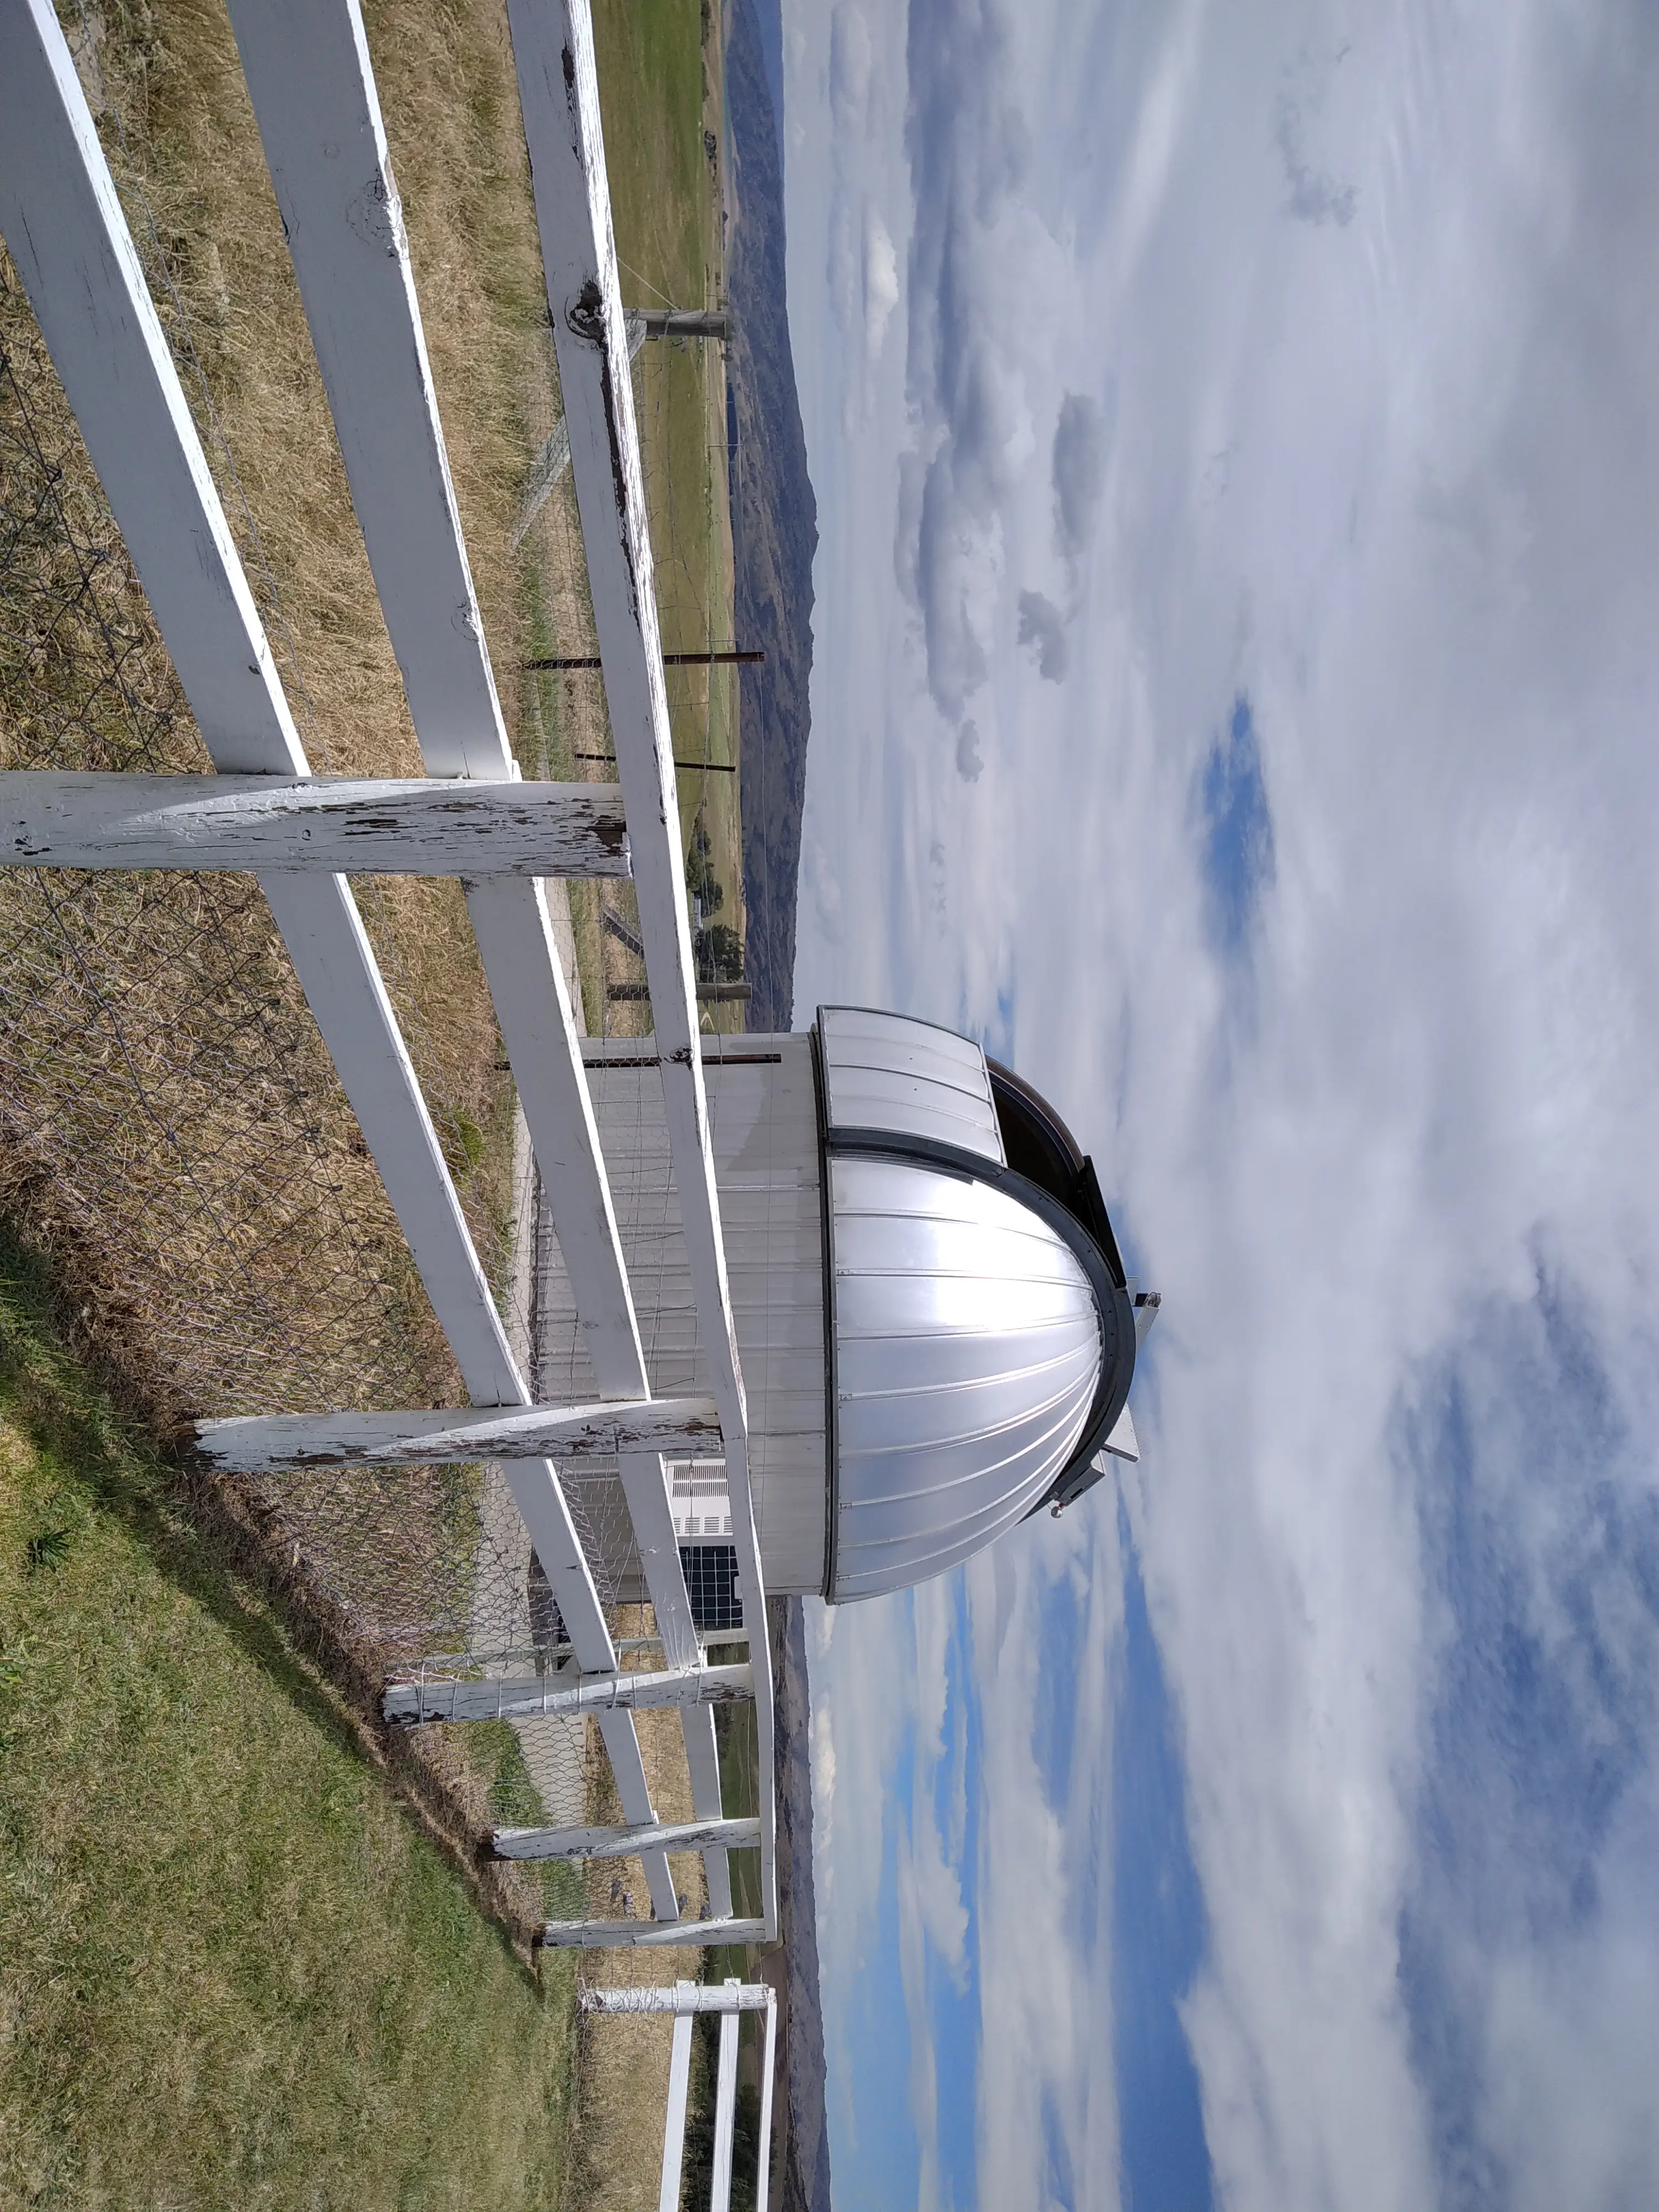
Dobson Spectrophotometer housing
The word of the week has definitely been Ozone, most of the devices onsite are used for ozone measurement but with a wide variety of different techniques; giving measurements of total column ozone, ozone at particular altitudes, daytime only and night time only ozone measurements. These measurements come from the Bruker, Dobson, Sonde, LiDAR, ground measurements using TEI and previously using a microwave radiometer. Along with all of these instruments I was amazed by the number of instruments placed here and maintained in collaboration with other research institutes around the world.
I also got told some key things to remember as an experimental scientist, first and foremost is consideration of accuracy, reliability, precision and stability of measurements. This is done by collecting lots of meta data, calibrating to remove systematic offset (improving accuracy), keeping good track of time (especially important for measurements depending on the sun) and reducing bias (through random throws etc.).
I have really enjoyed all of my three weeks with NIWA thanks to BLAKE. I’ve met lots of really cool people who seem to love the work they do and have learnt a lot about how atmospheric science is performed here in New Zealand and a little about what the data means for the health of our atmosphere. Definitely keen to keep in-touch with the connections I’ve made and share what I’ve learnt beyond this blog if anyone wants to learn more about what I’ve been up to.
Stay curious and thank you for reading.
Amy Burney
BLAKE NIWA Ambassador 2020